


 90 / 404

2 0 1 6 /
Y e a r b o o k /
T a i w a n S p o r t i n g G o o d s M a n u f a c t u r e r s A s s o c i a t i o n
90
Source: Materials Journals & Magazines, Company Websites & Presentations, Expert Interviews, and Markets and
Markets (2013), Protective Clothing Market by Application, End-Use Industry & Material- Global Trends & Forecast to
2018
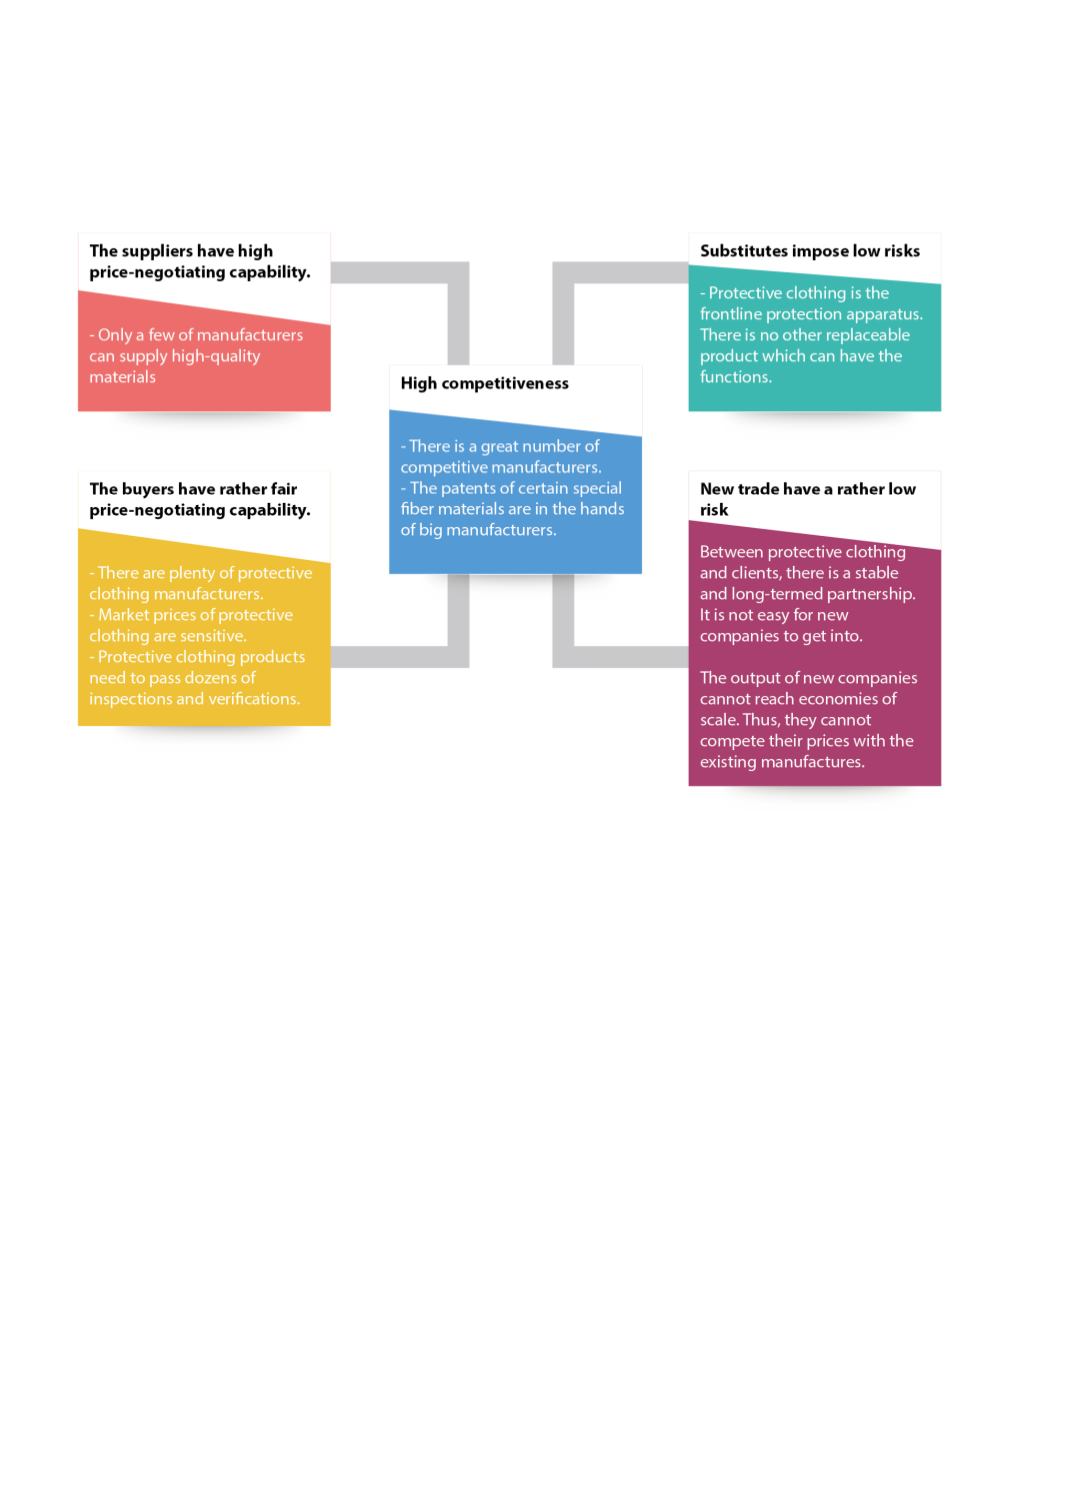
Figure 5: Market competitiveness of protective clothing- Porter’s analysis on 5 capabilities
4. Market analysis of global filter materials
In 2015, the global filter market scale reach up 65.9 billion US dollars. Estimated, in 2020 it will grow 37.9%, 90.9 billion
US dollars. From 2000 to 2005, the northern American region is the largest market; its global proportion is around
30%. From 2010 onwards, the Asia-Pacific region becomes the largest market in the world; the global ratio, 35%. More
importantly, the market share is increasing annually. It is predicted that market share will grow up to 36% and in 2020,
the ratio is expected to be 40%.
China’s filter market is growing quickly. In 2000, China’s market value in the Asia-Pacific region is 14.6%; in 2005, 22.3%.
In 2010, it grew up to 35.2%. And in 2015, it will break the record up to 40% and its global market share ratio is 42%. In
2020, it will continue the growth up to 46.8 and own 50% of the filter market share in the Asia-Pacific region.