


 85 / 404

85
Table 4: Market scale of global protective clothing by market regions
Regions
2011
2012
2013
2018
Annual compound
growth rate
(2013~2018)
Northern American
1,628
1,735
1,853
2,460
5.8
European
1,323
1,400
1,483
1,892
5.0
Asia Pacific
1,050
1,131
1,220
1,692
6.8
Middle East and African
683
729
779
1,050
6.2
Latin American
567
605
646
906
7.0
Total
5,250
5,600
5,980
8,000
6.0
End-Use Industry & Material- Global Trends & Forecast to 2018
Source: Markets and Markets (2013), Protective Clothing Market by Application, End-Use Industry & Material- Global
Trends & Forecast to 2018
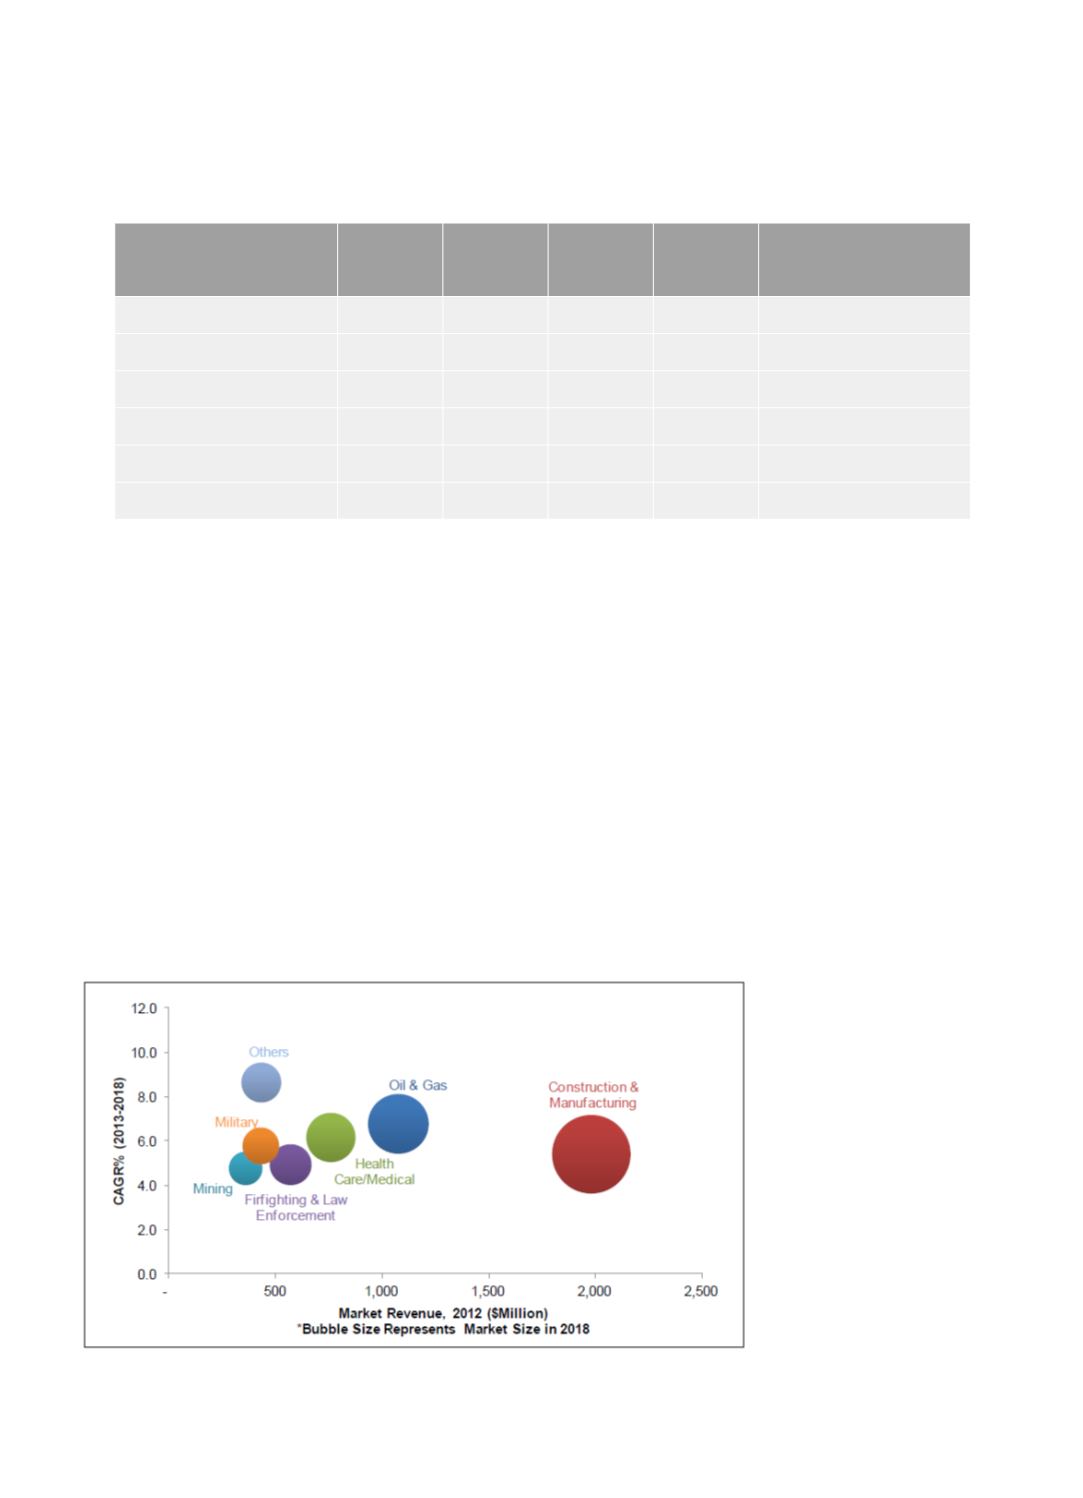
By various industries of protective clothing market scales, the construction and manufacturing industries have the
largest market scale of protective clothing; the next are oil and natural gas industry, healthcare and medical industries.
Their growth rates fall between 5% and 7%.
Indexmundi, Materials Journals & Magazines, Factiva, Company Websites & Presentations, Press Releases, Expert
Interviews, and Markets and Markets (2013),
Protective Clothing Market by Application, End-Use Industry & Material- Global
Trends & Forecast to 2018
Source: :International Labor Organization (ILO),
CCOHS.Org, ESPC, OSHA, Indexmundi, Materials Journals & Magazines,
Factiva, Company Websites & Presentations, Press Releases, Expert Interviews, and Markets and Markets (2013),
Pro t e c t i ve C l o t h i ng
Market by Application,
E n d - U s e I n d u s t r y &
Material- Global Trends &
Forecast to 2018